As you put the finishing touches on your event webpage, you tell yourself that all you can do now is wait and see who attends your conference. Deep down, though, wouldn’t you like to see the level of interest in your event so you could monitor its progress?
Sure, there are web traffic monitoring tools like Google Analytics, but you might not have access to any of them — or you might be struggling to integrate them into your event website. All you want to find out is how many people are visiting your webpage, who they are, and what they’re looking at. Is that really too much to ask?
You may already know that Whova can help you create agenda webpages quickly and easily. We’ve even improved our design options recently so you can build the best-looking pages possible. Now we’ve gone a step further to give you clear insights into webpage visitors, without the need for any extra analytics tools, experience, or effort.
The good news is that both the Agenda Webpage Builder and the Analytics are offered at no additional charge if you use our Whova event app.
See How Effective Your Event Promotion Is
You only have so many hours in the day to promote your event, so you want to use it wisely. With Whova, you can view the analytics for your agenda webpage with just the click of a button on the Whova dashboard. This gives you the exact information you need to understand whether your current event promotion is reaching your target audience. The analytics are updated daily, which means you don’t need to wait around worrying about your webpage traffic.
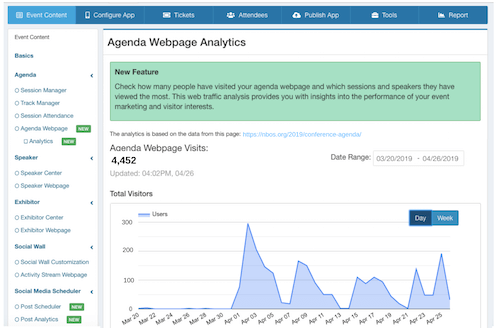
1. Total Agenda Visits
You can quickly spot trends by looking at the total agenda visits by weeks or days. Notice any dips or spikes in your agenda webpage traffic? Cross-reference the dates with your event promotion efforts and mentions on social media. You’ll be able to see what’s engaging your visitors — and what isn’t — so you can use the most effective event promotion methods moving forward.
2. Session and Speaker Views
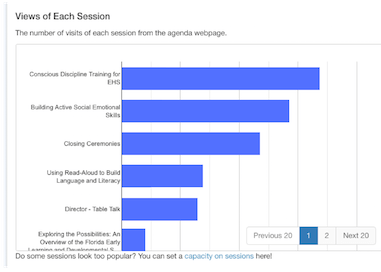 Whova’s Agenda Webpage Analytics include the views of each session and speaker, which can help you better promote and manage your event.
You can find out which speakers and sessions are getting the most traffic and highlight them in your event promotion emails and social posts. Getting a sense of visitor interests doesn’t only allow you to attract more attendees — you can also make your event more engaging by offering more sessions around these popular topics.
But wait, some individual sessions and speakers have such high traffic that you’re starting to panic. Maybe the auditorium won’t be big enough after all! Don’t worry: you can use Whova’s Session Caps and Check-In process to limit the number of attendees (and make sure everyone gets a seat!) And what if you notice that some speakers have very low traffic on your agenda webpage? Well, you can empower these speakers to promote themselves — and your event — through their social media profiles, thanks to Whova’s recent social media integration.
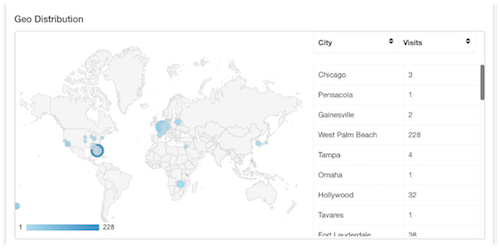
3. Geo Distribution
Has your conference expanded over the years? Whova’s geo distribution data shows you the number of views of your agenda webpage from different cities around the world. Knowing where your attendees are coming from can give you a better understanding of how your event is growing and inform any targeted promotion plans you had in mind.
Geo distribution can also make sure you’re prepared for any out-of-towners. By looking at the demographics, you can quickly determine whether there will be any attendees from other cities or countries who may need additional information. This will allow you to add maps, locations, and ride-sharing groups to the Whova app, helping your attendees get around and enjoy the whole event experience.
4. Device Distribution
Device distribution shows the percentage of people using desktop and mobile to look at your agenda webpage. You can leverage these analytics to make improvements to your event webpages and app. If you see that the majority of visitors are viewing your agenda webpage on their mobile phones, this is a great prompt to check that your site is mobile-friendly.
Easily Stay Up-to-Date With a Weekly Overview
As your event gets closer and you find yourself under even more stress, you might not have the chance to look at our dashboard every day. But we’ve made it easy to keep up to date with your Agenda Webpage Analytics, and still get the insight you need to inform your preparations.
As well as providing the analytics page on the Whova dashboard, we send you a weekly overview of your Agenda Webpage Analytics directly to your inbox. You’ll receive an email every week, from when you create your agenda webpage until your event has taken place. The overview will show you:
- How many visits your agenda webpage got that week and how that number compares with the previous week
- The top 4 speakers and the top 3 sessions of the week by the number of views
- The total views of each session that week
Once your event has ended, your Agenda Webpage Analytics will be added to your event report and available to download as a PDF to share with your team. This will allow you to analyze how successfully you drove traffic to your event and help drive your future event organization.
Haven’t Set Up Your Agenda Webpage?
It only takes a few minutes to get set up and to begin receiving analytics on your page.
By simply uploading a spreadsheet of your event schedule onto the Whova dashboard, you get an interactive online agenda including session details, speaker profiles, and interactive multi-day/multi-track schedules. You can choose between multiple design templates to create the look and feel you want for your event — and that’s it!
Start Tracking Your Event
Whova’s Agenda Webpage Analytics let you track your event without any technical skills, while still ensuring powerful visitor insights to support your event promotion and preparations. It’s quick, easy, and convenient.
Request more information to find out how you can monitor your event progress with Whova.
Popular Articles