August 25, 2025
Back at her desk, Maya – the lead organizer of an annual tech summit – sat at her laptop. The venue had been cleared, the team was settling back into routine, and attendees were already sharing photos and highlights on social media. But Maya had already moved on to the next phase: post-event analysis.
Her boss had one big question: “How did this year compare to last year?”
Followed closely by: “What worked? What needs to change?”
Maya had the full 50-page event’s report from Whova as well as the Whova attendee analytics from the event that just ended. But when it came to comparing it with last year’s event, things got messy.
She spent more time finding and combining information than actually analyzing it. Attendance numbers, revenue, marketing campaigns, sponsor impressions, exhibitor leads – everything was stored in different files, some with different formats.
When she finally managed to gather it all, she hit another wall: how to display it side-by-side in a clear and organized way. “How long is it going to take me to combine and visualize all this in charts?” Maya thought to herself.
If only the data from both events could organize itself and highlight the insights without all the guesswork.
Now it can! Whova is excited to introduce our newest feature – Cross-Event Comparison Report. We’ve heard stories like Maya’s, so we created a powerful tool that empowers organizers to make smarter, data-driven decisions by seamlessly comparing valuable insights across events.
The Cross-Event dashboard pulls all the information for you, showing data from the current and the chosen past event side-by-side with clear graphics and valuable insights. All you have to do is review the results and start making decisions, staying confident that your conclusions are solid and your strategy for future events is built on a strong, informed foundation.
Ready to stop scrambling and start strategizing? Let’s dive in.
Use Cross-Event Comparisons to Improve Your Event Strategy
With the Cross-Event Report, you get a clear, visual breakdown of the numbers that matter most — helping you spot trends, compare event performance, and uncover meaningful insights at a glance. Some of the questions the report can help you answer:
“How did the event location affect who attended?”
Compare geographic and industry distributions to see how different cities or regions influenced turnout. For example, if you hosted one event in a major tech hub and another in a smaller city, you can easily see how that affected the industries and regions your attendees came from.
“Which session topics became more popular?”
See which sessions drew the most interest year-over-year to inform next year’s agenda. For instance, if your AI-related sessions saw a significant increase in attendance compared to last year, you might prioritize expanding that topic in future programs.
“How did the timing of the Call for Speakers affect submission numbers?”
Identify how earlier or later launches impacted submission volume and quality. If you opened the Call for Speakers two months earlier this year and saw more submissions, that insight can help shape your timeline going forward.
“Did the early bird registration boost revenue?”
If you adjusted your pricing strategy or registration timeline, now you can clearly see the results. For example, if you launched early bird pricing earlier this year, you can compare how that impacted total revenue or how quickly tickets sold compared to last year.
“How did this year’s marketing efforts impact sales?”
Directly compare registration and sales data across events to understand what worked — and what didn’t. You might compare a year where you ran a targeted LinkedIn ad campaign with a year focused on email outreach, and instantly see which strategy brought in more registrations.
Quickly identify trends in attendee types, industries, and ticket performance to better plan your next event.
Whether you’re evaluating attendee growth, testing new pricing strategies, or assessing the success of a marketing campaign, the Cross-Event Report brings clarity to your metrics and confidence to your planning.
Set Up the Report in Just a Few Steps
Accessing the Cross-Event Report is simple — it’s located under the “Manage Attendees” dropdown within the Attendees section of your dashboard.
You’ll be able to access it during or after your event. If the event is still ongoing, certain sections will display an “in-progress” status, and more data will populate once the event concludes.
To begin, simply select a past event from the dropdown menu at the top of the dashboard. All comparison data — such as attendee registration performance, audience demographics, and most popular sessions — will automatically populate. From there, you can review the report in Whova, export the full report, or download only the sections you need.
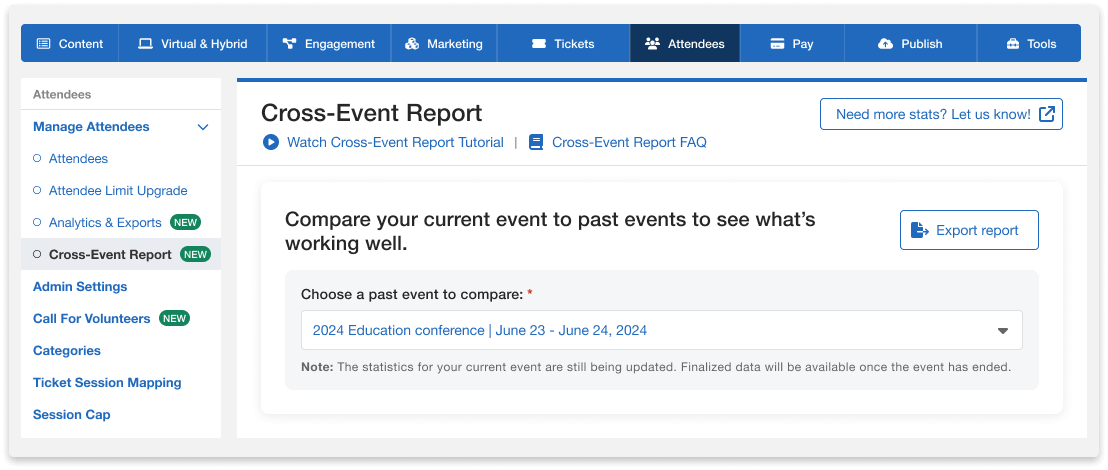
Easily select a past event and instantly view side-by-side comparisons with your current event, all in one dashboard.
Dive Into the Report
Once the report is set up, the dashboard will automatically display side-by-side visual comparisons across three key areas:
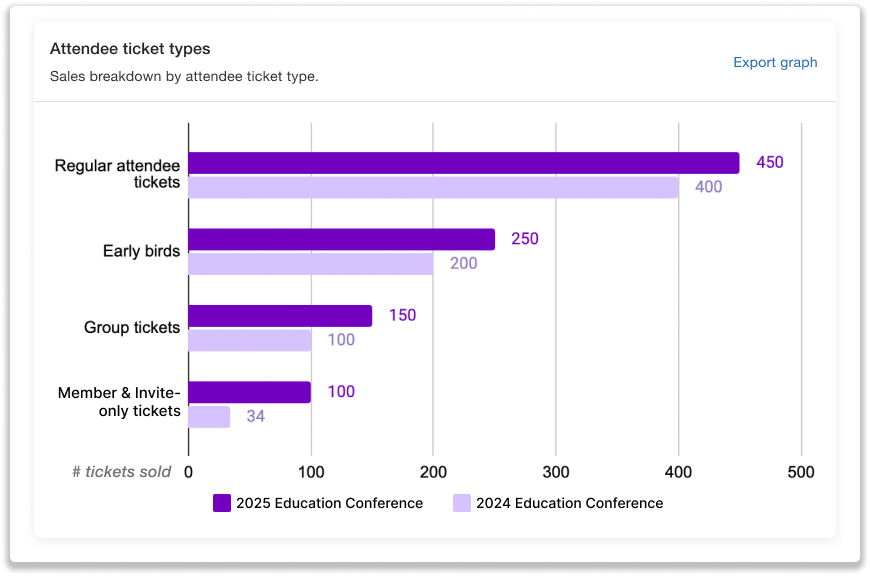
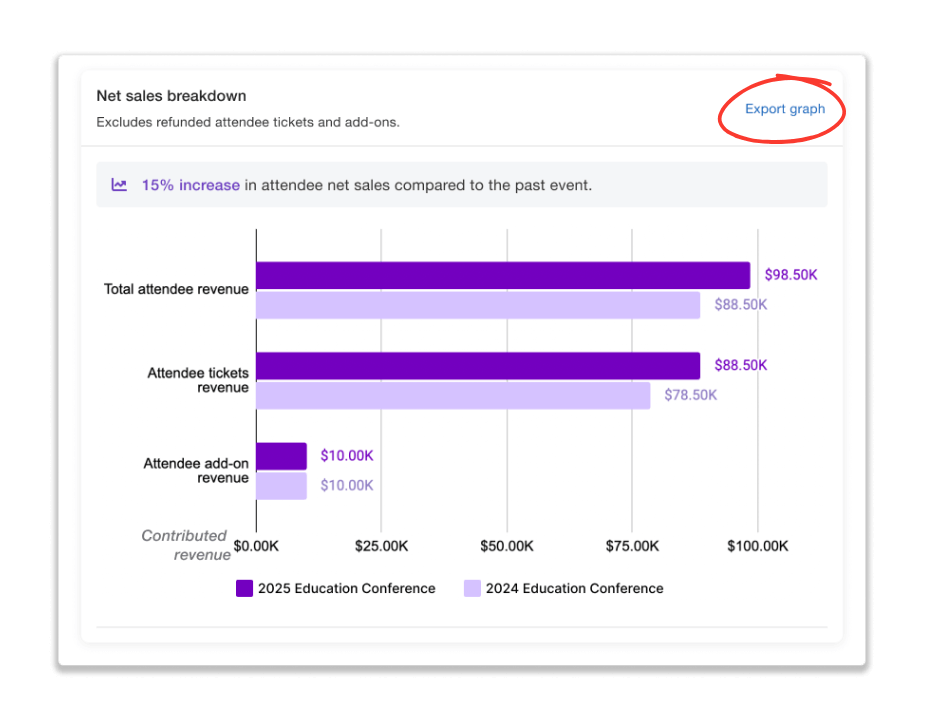
- Attendee Registration: Get a comprehensive look at net sales, with summaries of ticket and add-on purchases and a breakdown of attendee ticket types.
- Attendee Demographics: View the total number of new and returning attendees, along with a breakdown by attendee categories, top affiliations, industries, geographic locations, and participation type (in-person or virtual).
- Engagement: Explore which sessions drew the most interest based on personal agendas, plus insights into Call for Speakers submissions and review activity.
Once you’ve reviewed the data in the dashboard, you can export the full report or download only the graphs you need.
Export the Full Report With Ease
Once your event ends, you’ll be able to export the entire Cross-Event Report in one click by selecting “Export report” at the top of the page. If your event is still ongoing, you can request to be notified or choose to receive the final report by email as soon as it’s ready.
Need just a section of the report? No problem. You can download individual graphs (e.g. ticket sales, demographics, geo-distribution) as PDF or PNG by clicking the “Export graph” button near each chart.
Export the full report or just the sections you need for a faster, more focused review.
Turn Insight Into Impact: Try the Cross-Event Report Now
No more digging through old files, no more messy Excel formulas. Just actionable insights that help you plan smarter, improve faster, and grow confidently.
Access the Cross-Event Report in your organizer dashboard now or learn more about Whova’s Event Registration Software and Post-Event Reports.